
Return to P&As Outcome Data Tables report list
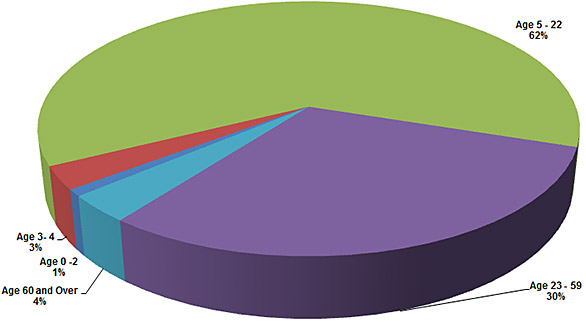
Clients’ Age Groups
Download the Clients’ Age Groups data (XLSX, 21.4KB)
| P&A | Age 0–2 | Age 3–4 | Age 5–22 | Age 23–59 | Age 60+ | Total |
|---|---|---|---|---|---|---|
| Alaska | 0 | 2 | 78 | 17 | 3 | 100 |
| Alabama | 0 | 0 | 129 | 109 | 21 | 259 |
| Arkansas | 0 | 0 | 70 | 23 | 4 | 97 |
| American Samoa | 0 | 0 | 19 | 0 | 0 | 19 |
| Arizona | 5 | 27 | 529 | 50 | 4 | 615 |
| California | 11 | 27 | 604 | 282 | 28 | 952 |
| Colorado | 0 | 1 | 81 | 33 | 2 | 117 |
| Connecticut | 0 | 4 | 40 | 11 | 10 | 65 |
| District of Columbia | 0 | 3 | 25 | 33 | 5 | 66 |
| Delaware | 4 | 4 | 121 | 49 | 3 | 181 |
| Florida | 2 | 9 | 259 | 203 | 14 | 487 |
| Georgia | 2 | 7 | 119 | 165 | 23 | 316 |
| Guam | 6 | 2 | 45 | 15 | 1 | 69 |
| Hawaii | 3 | 24 | 263 | 35 | 2 | 327 |
| Iowa | 0 | 0 | 21 | 22 | 4 | 47 |
| Idaho | 3 | 1 | 62 | 35 | 1 | 102 |
| Illinois | 3 | 31 | 534 | 225 | 15 | 808 |
| Indiana | 0 | 1 | 75 | 63 | 9 | 148 |
| Kansas | 1 | 5 | 139 | 100 | 6 | 251 |
| Kentucky | 3 | 4 | 83 | 143 | 19 | 252 |
| Louisiana | 11 | 4 | 73 | 82 | 5 | 175 |
| Massachusetts | 0 | 4 | 84 | 28 | 5 | 121 |
| Maryland | 2 | 7 | 105 | 111 | 7 | 232 |
| Maine | 0 | 8 | 177 | 312 | 43 | 540 |
| Michigan | 1 | 4 | 285 | 28 | 5 | 323 |
| Minnesota | 5 | 15 | 384 | 112 | 5 | 521 |
| Missouri | 1 | 10 | 169 | 95 | 9 | 284 |
| Federated States of Micronesia | 9 | 4 | 59 | 15 | 0 | 87 |
| Mississippi | 1 | 7 | 143 | 28 | 1 | 180 |
| Montana | 0 | 0 | 26 | 40 | 3 | 69 |
| Native American P&A | 2 | 1 | 27 | 13 | 1 | 44 |
| North Carolina | 2 | 1 | 135 | 84 | 3 | 225 |
| North Dakota | 0 | 5 | 157 | 289 | 57 | 508 |
| Nebraska | 0 | 0 | 32 | 14 | 0 | 46 |
| New Hampshire | 6 | 7 | 217 | 146 | 15 | 391 |
| New Jersey | 0 | 29 | 264 | 258 | 50 | 601 |
| New Mexico | 0 | 0 | 55 | 65 | 5 | 125 |
| Nevada | 2 | 6 | 52 | 29 | 4 | 93 |
| New York | 13 | 61 | 1,353 | 438 | 18 | 1,883 |
| Ohio | 8 | 21 | 501 | 224 | 21 | 775 |
| Oklahoma | 9 | 21 | 495 | 295 | 19 | 839 |
| Oregon | 2 | 1 | 90 | 35 | 2 | 130 |
| Pennsylvania | 1 | 20 | 458 | 460 | 37 | 976 |
| Puerto Rico | 15 | 80 | 1,239 | 56 | 1 | 1,391 |
| Rhode Island | 0 | 5 | 115 | 118 | 31 | 269 |
| South Carolina | 0 | 3 | 91 | 24 | 1 | 119 |
| South Dakota | 0 | 3 | 120 | 46 | 3 | 172 |
| Tennessee | 0 | 1 | 64 | 14 | 3 | 82 |
| Texas | 14 | 43 | 798 | 279 | 51 | 1,185 |
| Utah | 1 | 10 | 202 | 106 | 13 | 332 |
| Virginia | 0 | 4 | 101 | 52 | 18 | 175 |
| Virgin Island | 1 | 2 | 47 | 10 | 3 | 63 |
| Vermont | 9 | 13 | 195 | 82 | 8 | 307 |
| Washington | 5 | 3 | 102 | 113 | 28 | 251 |
| Wisconsin | 1 | 2 | 169 | 24 | 2 | 198 |
| West Virginia | 0 | 0 | 35 | 17 | 3 | 55 |
| Wyoming | 0 | 0 | 12 | 62 | 9 | 83 |
| Total | 164 | 557 | 11,927 | 5,817 | 663 | 19,128 |
| Pct. FY 2013 | 1% | 3% | 62% | 30% | 3% | 100% |