
Return to P&As Outcome Data Tables report list
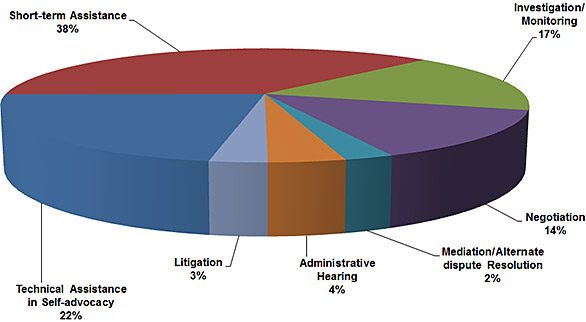
Intervention Strategies Used in Serving Clients
Download the Intervention Strategies Used in Serving Clients data (XLSX, 19.5KB)
| P&A | Technical Assistance in Self- Advocacy |
Short-term Assistance |
Investigation Monitoring |
Negotiation | Mediation Alternate Dispute Resolution |
Administrative Hearing |
Litigation | Total |
|---|---|---|---|---|---|---|---|---|
| Alaska | 0 | 36 | 10 | 6 | 4 | 2 | 1 | 59 |
| Alabama | 11 | 68 | 37 | 16 | 5 | 1 | 6 | 144 |
| Arkansas | 5 | 58 | 7 | 3 | 1 | 1 | 3 | 78 |
| American Samoa |
4 | 2 | 2 | 1 | 0 | 0 | 0 | 9 |
| Arizona | 561 | 19 | 1 | 8 | 0 | 0 | 0 | 589 |
| California | 2 | 839 | 13 | 33 | 2 | 14 | 1 | 904 |
| Colorado | 26 | 31 | 3 | 13 | 0 | 5 | 0 | 78 |
| Connecticut | 3 | 5 | 0 | 14 | 2 | 4 | 1 | 29 |
| District of Columbia | 0 | 22 | 2 | 8 | 0 | 1 | 2 | 35 |
| Delaware | 27 | 66 | 10 | 18 | 2 | 17 | 2 | 142 |
| Florida | 126 | 73 | 32 | 65 | 10 | 17 | 29 | 352 |
| Georgia | 33 | 124 | 57 | 40 | 1 | 6 | 3 | 264 |
| Guam | 3 | 18 | 0 | 0 | 3 | 1 | 22 | 47 |
| Hawaii | 23 | 51 | 78 | 85 | 1 | 6 | 4 | 248 |
| Iowa | 1 | 27 | 6 | 2 | 3 | 1 | 3 | 43 |
| Idaho | 45 | 36 | 13 | 1 | 4 | 0 | 5 | 104 |
| Illinois | 369 | 80 | 132 | 71 | 1 | 14 | 14 | 681 |
| Indiana | 12 | 38 | 21 | 3 | 4 | 3 | 1 | 82 |
| Kansas | 152 | 44 | 6 | 0 | 2 | 4 | 26 | 234 |
| Kentucky | 12 | 63 | 22 | 22 | 3 | 5 | 1 | 128 |
| Louisiana | 2 | 36 | 3 | 33 | 1 | 11 | 18 | 104 |
| Massachusetts | 0 | 79 | 0 | 16 | 1 | 2 | 1 | 99 |
| Maryland | 27 | 44 | 10 | 43 | 1 | 17 | 1 | 143 |
| Maine | 27 | 197 | 66 | 123 | 7 | 35 | 5 | 460 |
| Michigan | 21 | 78 | 59 | 16 | 2 | 21 | 7 | 204 |
| Minnesota | 177 | 106 | 0 | 51 | 0 | 7 | 9 | 350 |
| Missouri | 21 | 54 | 74 | 72 | 1 | 10 | 7 | 239 |
| Federated States of Micronesia | 1 | 5 | 52 | 9 | 1 | 0 | 1 | 69 |
| Mississippi | 14 | 50 | 6 | 57 | 4 | 6 | 7 | 144 |
| Montana | 0 | 25 | 25 | 1 | 0 | 0 | 3 | 54 |
| Native American P&A | 4 | 0 | 3 | 1 | 2 | 2 | 4 | 16 |
| North Carolina | 2 | 152 | 2 | 18 | 4 | 3 | 5 | 186 |
| North Dakota | 3 | 43 | 496 | 10 | 0 | 3 | 1 | 556 |
| Nebraska | 0 | 0 | 17 | 0 | 0 | 0 | 1 | 18 |
| New Hampshire | 99 | 32 | 1 | 2 | 0 | 2 | 0 | 136 |
| New Jersey | 125 | 31 | 189 | 17 | 10 | 13 | 12 | 397 |
| New Mexico | 2 | 65 | 1 | 8 | 0 | 7 | 6 | 89 |
| Nevada | 25 | 41 | 1 | 1 | 2 | 5 | 2 | 77 |
| New York | 241 | 459 | 397 | 206 | 100 | 114 | 93 | 1,610 |
| Ohio | 72 | 445 | 157 | 41 | 12 | 34 | 6 | 767 |
| Oklahoma | 17 | 364 | 4 | 86 | 6 | 26 | 5 | 508 |
| Oregon | 2 | 22 | 2 | 34 | 3 | 4 | 4 | 71 |
| Pennsylvania | 349 | 371 | 82 | 15 | 2 | 1 | 3 | 823 |
| Puerto Rico | 3 | 101 | 79 | 396 | 118 | 43 | 18 | 758 |
| Rhode Island | 23 | 25 | 22 | 8 | 0 | 1 | 2 | 81 |
| South Carolina | 24 | 14 | 17 | 18 | 0 | 1 | 3 | 77 |
| South Dakota | 4 | 29 | 8 | 58 | 1 | 18 | 3 | 121 |
| Tennessee | 16 | 25 | 12 | 16 | 10 | 0 | 3 | 82 |
| Texas | 79 | 422 | 165 | 184 | 9 | 51 | 41 | 951 |
| Utah | 35 | 231 | 27 | 9 | 2 | 22 | 2 | 328 |
| Virginia | 44 | 64 | 22 | 26 | 1 | 0 | 2 | 159 |
| Virgin Islands | 0 | 15 | 5 | 3 | 0 | 1 | 5 | 29 |
| Vermont | 102 | 100 | 2 | 23 | 0 | 9 | 21 | 257 |
| Washington | 253 | 1 | 4 | 2 | 0 | 0 | 0 | 260 |
| Wisconsin | 30 | 63 | 18 | 29 | 13 | 7 | 6 | 166 |
| West Virginia | 1 | 25 | 6 | 18 | 6 | 0 | 1 | 57 |
| Wyoming | 0 | 31 | 39 | 0 | 0 | 0 | 0 | 70 |
| Total | 3,260 | 5,545 | 2,525 | 2,059 | 367 | 578 | 432 | 14,766 |
| Pct. FY 2013 | 22% | 38% | 17% | 14% | 2% | 4% | 3% | 100% |